客户一套10gR2 rac升级到11.2.0.3 rac 后,出现了严重性能问题,其中表现为一个节点负载极高,响应缓慢。
ucp库3节点负载很高,主要原因的latch过多导致,通过等待事件可以发现,存在大量的library cache latch争用:
EVENT                                                              COUNT(*)
---------------------------------------------------------------- ----------
SQL*Net message from client                                             211
enq: TX - row lock contention                                            17
.......省略部分内容
library cache: mutex X                                                   75

事实上,在10号最为严重的时候,library cache:mutex X 等待一度超过400个,如下:
TO_CHAR(SAMPLE_TIME,'YYYYMMDDHH24:MI:SS')     EVENT                        COUNT(*)
--------------------------------------------- -------------------------- ----------
20121010 12:14:36                             library cache: mutex X             11
20121010 12:14:46                             library cache: mutex X              4
20121010 12:14:56                             library cache: mutex X              1
20121010 12:15:06                             library cache: mutex X              9
20121010 12:15:16                             library cache: mutex X             24
20121010 12:15:26                             library cache: mutex X             10
20121010 12:15:36                             library cache: mutex X             30
20121010 12:15:56                             library cache: mutex X              2
20121010 12:16:06                             library cache: mutex X            447
20121010 12:16:16                             library cache: mutex X            483
20121010 12:16:26                             library cache: mutex X            353
20121010 12:16:36                             library cache: mutex X            206
20121010 12:16:47                             library cache: mutex X             36
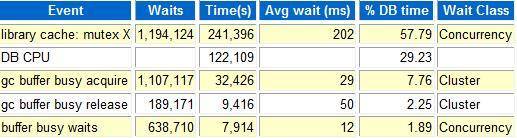
另外,同awr报告我们可以也发现top 5排在第一位的也是该等待事件。
我们这里以时间点20121010 12:16:06进行分析:
SESSION_ID    USER_ID SQL_ID        BLOCKING_SESSION EVENT
---------- ---------- ------------- ---------------- ------------------------
       700         84 0k8522rmdzg4k             1750 library cache: mutex X
.........
       675         84 cm5vu20fhtnq1             1750 library cache: mutex X
       673         84 cm5vu20fhtnq1             1750 library cache: mutex X
       672         84 cm5vu20fhtnq1             1750 library cache: mutex X
       650         84 0k8522rmdzg4k             1750 library cache: mutex X
       559         84 0k8522rmdzg4k             1750 library cache: mutex X
       558         84 0k8522rmdzg4k             1750 library cache: mutex X
      1582         84                            626 library cache: mutex X
      1581         84 0k8522rmdzg4k             1750 library cache: mutex X
      1577         84                                library cache: mutex X
      1575         84 0k8522rmdzg4k             1750 library cache: mutex X
      1574         84                            440 library cache: mutex X
      1571         84 cm5vu20fhtnq1             1750 library cache: mutex X
      1569          0                           2123 library cache: mutex X
      1567         84                            440 library cache: mutex X
      1552         84                                library cache: mutex X
      1550          0                           2123 library cache: mutex X
      1548         84 5ur69atw3vfhj              626 library cache: mutex X
.....省略部分内容

从上面看到对于阻塞源头,1750 session较多,针对session 1750,进行进一步分析:

SESSION_ID    USER_ID SQL_ID        BLOCKING_SESSION EVENT
---------- ---------- ------------- ---------------- ------------------------------------------------------------
      1750         84                           1945 library cache: mutex X
      1750         84                           1582 library cache: mutex X
      1750         84 cm5vu20fhtnq1                  library cache: mutex X
      1750         84                            672 library cache: mutex X
      1750         84                            553 library cache: mutex X

下面根据session 672 进行分析:

SESSION_ID    USER_ID SQL_ID        BLOCKING_SESSION EVENT
---------- ---------- ------------- ---------------- -------------------------------------------------------
       672         84                                library cache: mutex X
       672         84                            785 library cache: mutex X
       672         84                                library cache: mutex X
       672         84                           1193 library cache: mutex X
       672         84                                library cache: mutex X
       672         84                            795 library cache: mutex X
       672         84                                library cache: mutex X
       672         84                                library cache: mutex X
       672         84                                library cache: mutex X
       672         84                           2267 library cache: mutex X
       672         84                            298 library cache: mutex X
.........
       672         84 5tzsbrs042ytv                  gc current request
       672         84 1xbjfzyzrgzrq                  gc current request

接着我们寻找session 785的源头:


SESSION_ID    USER_ID SQL_ID        BLOCKING_SESSION EVENT
---------- ---------- ------------- ---------------- -------------------------------------------------------
       785         84                                library cache: mutex X
       785         84                            832 library cache: mutex X
       785         84                                library cache: mutex X
       785         84                                library cache: mutex X
       785         84                           1582 library cache: mutex X
       785         84                            626 library cache: mutex X
       785         84 2rk2abzx7c509              206 gc buffer busy acquire
       785          0                                latch free
我们可以看到785session 阻塞了672,同时被206所阻塞,785 session持有的event正是gc buffer busy acquire。
事实上再上述时间段内,上面2个event的等待也是比较高的,如下查询:
SQL> select event,count(1) from  DBA_HIST_ACTIVE_SESS_HISTORY where snap_id >86 and snap_id < 89
  2  and event in('gc current request','gc buffer busy acquire') group by event;

EVENT                                                     COUNT(1)
------------------------------------------------------- ----------
gc current request                                             124
gc buffer busy acquire                                         203
正好印证了Bug 12998795 - RAC hang with signature 'gc current request'<='gc buffer busy acquire' [ID 12998795.8] 通过查询oracle metalink我们可以发现,该bug其实跟Bug 12847466 - RAC hang with waits 'gc current request'<='gc buffer busy acquire' 是一回事,可以通过调整oracle隐含参数_gc_read_mostly_locking 来解决。 这里补充一下: gc buffer busy acquire和gc buffer busy release 其实是以前版本中gc buffer busy的一个细粒度划分。 read mostly locking实际上是11.2 引入的一个特性,通过在mos查询,我们可以看到该特性还可能导致如下的几个bug(并且还都是rac环境):
Bug 12408350 - ORA-600 [kjbrasr:pkey] in RAC with read mostly locking
Bug 12777508 - RAC instance crash due to ORA-600 [kclanticheck_2] in LCK with read mostly locking
Bug 9121944 - ORA-600 [kcl_flash2le_6] / ORA-600 [kjbexitdlm:e] with read mostly locking in RAC
Bug 12834027 - ORA-600 [kjbmprlst:shadow] / ORA-600 [kjbrasr:pkey] with RAC read mostly locking

另外,通过今天的分析发现,目前v$session反应出来的library cache: mutex X 如此之高,通过查询v$mutex_seep可以看到其该等待sleeps最高的
location正是kglhdgn1,如下:

MUTEX_TYPE                       LOCATION                                     SLEEPS  WAIT_TIME
-------------------------------- ---------------------------------------- ---------- ----------
Library Cache                    kglhdgn1  62                              485900083          0
Library Cache                    kglhdgh1  64                               15447706          0
Library Cache                    kglhdgn2 106                               11212602          0
Library Cache                    kgllkdl1  85                                8887003          0
Library Cache                    kglpnal2  91                                4053372          0
Library Cache                    kglpndl1  95                                1673491          0
Library Cache                    kglic1    49                                 774796          0
Library Cache                    kglget1   1                                  504328          0
Library Cache                    kglpin1   4                                  383993          0
Library Cache                    kglpnal1  90                                 362187          0
Library Cache                    kgllkal1  80                                 315482          0
Library Cache                    kgllkc1   57                                  81569          0
我们知道导致library cahce:mutex X争用的无非就如下几个原因:
1) 硬解析过高
2) SQL High Version Counts
3) high reloads in the sql area
4) Shared pool设置问题
5) oracle bug(例如cursor_sharing设置为similar,force都可以导致,当然similar熟悉在11.2被废弃了)
从第一次的awr看,硬解析确实有些高,所以客户调整了cursor_sharing为force,硬解析降下去了,但是问题仍然没有解决。
从目前的信息来看,调整了cursor_sharing为force,并没有从根本上解决问题,甚至还有副作用。
从该现象来看,该问题也命中了oracle Bug 12797420 “library cache: mutex X” waits on DB instance handle with CURSOR_SHARING,通过检查
数据库alert log发现,cursr_sharing参数是在9号下午调整的:
Tue Oct 09 16:45:03 2012
ALTER SYSTEM SET cursor_sharing='FORCE' SCOPE=BOTH;

调整cursor_sharing参数,可以大大降低系统的硬解析,通过查看10月8号的awr可以看到,在调整cursr_sharing参数之前3节点
的软解析命中率仅仅为76%左右,如下:
Buffer Nowait %: 99.93        Redo NoWait %: 100.00
Buffer Hit %: 99.94           In-memory Sort %: 100.00
Library Hit %: 76.70          Soft Parse %: 76.27
Execute to Parse %: 23.51     Latch Hit %: 99.74
Parse CPU to Parse Elapsd %: 18.14 % Non-Parse CPU: 80.02

调整之后的命中率为99%左右,如下:
Buffer Nowait %: 99.99        Redo NoWait %: 100.00
Buffer Hit %: 99.99           In-memory Sort %: 100.00
Library Hit %: 99.77          Soft Parse %: 99.84
Execute to Parse %: 42.42     Latch Hit %: 99.85
Parse CPU to Parse Elapsd %: 78.31 % Non-Parse CPU: 96.74
通过分析Bug 12797420 – “library cache: mutex X” waits on DB instance handle with CURSOR_SHARING [ID 12797420.8]文档,可以发现
该bug其实在11.2.0.3的最新psu 11.2.0.3.3中已经修复
而前面提到的bug事实上也都在11.2.0.3.1 或11.2.0.3.2等psu中修复了,所以,我建议不采取调整隐含参数或安装个别patch的方式来解决
该问题,而是直接安装11.2.0.3的最新psu,这样不但能解决问题,而且还能避免一些其他的未知bug。
补充:由于部分bug例如12777508 在11.2.0.3.3中仍然未能修复,虽然目前未遭遇该bug,但是该bug是一个比较致命的bug,且在12.1版本中
才能修改,故建议仍然调整参数 “_gc_read_mostly_locking”=false。
最后我们来看一下上面提到的这个特性 read mostly locking,该特性只有在rac环境中才会存在,从gc参数就可以发现,是针对global cache,
从高查询文档发现该特性其实是从11.2.0.2才引入的,在11.2.0.1都中不存在。
通过观察试图V$CURRENT_BLOCK_SERVER 我们可以找到一些相关想信息:
SQL> desc V$CURRENT_BLOCK_SERVER
 Name                                      Null?    Type
 ----------------------------------------- -------- ----------------------------
 PIN1                                               NUMBER
 PIN10                                              NUMBER
 PIN100                                             NUMBER
 PIN1000                                            NUMBER
 PIN10000                                           NUMBER
 FLUSH1                                             NUMBER
 FLUSH10                                            NUMBER
 FLUSH100                                           NUMBER
 FLUSH1000                                          NUMBER
 FLUSH10000                                         NUMBER
 WRITE1                                             NUMBER
 WRITE10                                            NUMBER
 WRITE100                                           NUMBER
 WRITE1000                                          NUMBER
 WRITE10000                                         NUMBER
 CLEANDC                                            NUMBER  --11.2.0.2引入
 RCVDC                                              NUMBER  --11.2.0.2引入
 QUEUEDC                                            NUMBER  --11.2.0.2引入
 EVICTDC                                            NUMBER  --11.2.0.2引入
 WRITEDC                                            NUMBER  --11.2.0.2引入
我们来看官方文档针对这几个字段的描述:
CLEANDC Reserved for internal use
RCVDC Number of lock down-converts to S (shared) caused by instance recovery
QUEUEDC Number of queued lock down-converts to NULL
EVICTDC Number of lock down-converts to NULL caused by an SGA shrink
WRITEDC Number of dirty blocks in read-mostly objects which were written and the X (exclusive) lock down-converted to S (shared) locks
这里的关键字段WRITEDC比较特性,提到了提个read-mostly objects的概念,从上面的描述我们不难猜出是这个含义:
针对global cache bufer中的脏块,如果oracle发现某些对象的脏块同时被read的比较多,那么会把
这些脏块所被持有的lock 级别降低,即从X lock降低到S lock模式。
当然,这里oracle必然存在一个监控的机制,比如它如何判断哪些对象的脏块仍然存在大量的read操作?以及是如何量化
这个多少的标准?我想应该是通过几个隐含参数来进行控制的。
我们知道对于mode为6的X lock,能降低到S lock模式,是一个非常好的设计,可以很大程度上降低lock争用。
只是oracle往往推出的一些新特性,都伴随着大量的bug,这个虽然令人厌烦不过也是一种进步!
这样再次说明,升级到新版本中,强烈建议安装最新的psu!
发表回复