近期某客户一套系统不定期偶尔出现实例hung情况,导致业务运行缓慢;问题出现时间有时候是早高峰,有时候是晚上下班之后。通过同事提供的Oracle AWR报告来看,确实有一些异常:
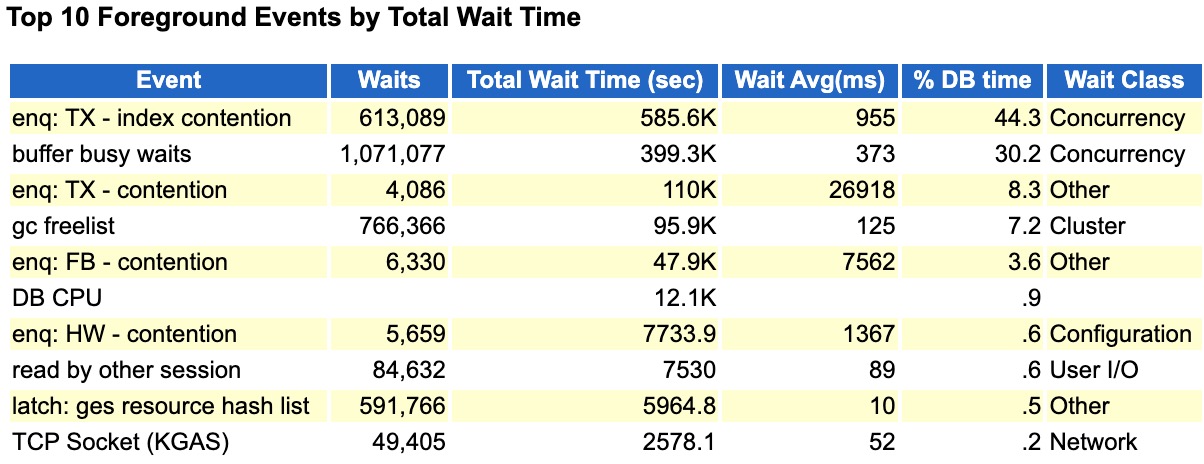
可以看到top event中出现了大量的索引分裂、buffer busy waits、以及高水位相关等待。实际上查看该awr我发现
数据库整体负载并不高,Sessions大概在1100左右,SQL executes 5000/s左右,同时每秒redo 日志量也就是1M/s.
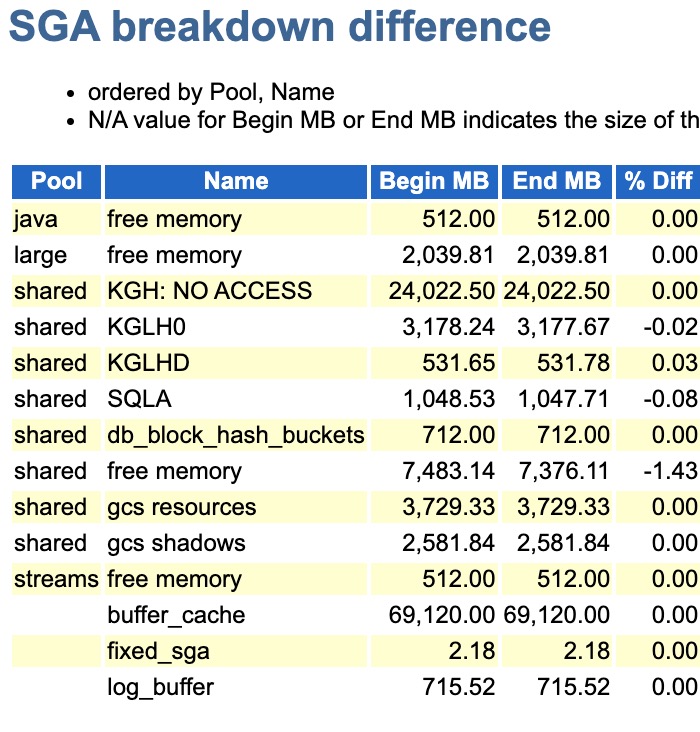
最开始同事怀疑是Oracle AMM内存自动管理的问题,不过我分析前后2天的awr发现,在故障时间段内,内存其实并没有什么波动:
后续甚至怀疑过是不是NUMA没关闭导致的问题,这几个点我认为可能性都不大。由于数据库hung住,必然会产生hanganalyze trace文件,或许从这能看到一些有价值的信息(这也是Oracle的强大支持,国产数据库还需加强)。
===============================================================================
HANG ANALYSIS:
  instances (db_name.oracle_sid): xxxx.xxxx1, xxxx.xxxx2
  no oradebug node dumps
  os thread scheduling delay history: (sampling every 1.000000 secs)
    0.000000 secs at [ 09:36:51 ]
      NOTE: scheduling delay has not been sampled for 0.898672 secs    0.000000 secs from [ 09:36:47 - 09:36:52 ], 5 sec avg
    0.000000 secs from [ 09:35:53 - 09:36:52 ], 1 min avg
    0.000000 secs from [ 09:31:53 - 09:36:52 ], 5 min avg
  vktm time drift history
===============================================================================

Chains most likely to have caused the hang:
 [a] Chain 1 Signature: 'gc freelist'<='enq: TX - index contention'
     Chain 1 Signature Hash: 0x7a6e5ce1
 [b] Chain 2 Signature: 'gc freelist'<='enq: TX - index contention'
     Chain 2 Signature Hash: 0x7a6e5ce1
 [c] Chain 3 Signature: 'gc freelist'<='enq: TX - contention'
     Chain 3 Signature Hash: 0x2eec4b0b

===============================================================================
Non-intersecting chains:

-------------------------------------------------------------------------------
Chain 1:
-------------------------------------------------------------------------------
    Oracle session identified by:
    {
                instance: 2 (xxxx.xxxx2)
                   os id: 155590
              process id: 960, oracle@xxxx2
              session id: 16
        session serial #: 6389
    }
    is waiting for 'enq: TX - index contention' with wait info:
    {
                      p1: 'name|mode'=0x54580004
                      p2: 'usn<<16 | slot'=0xc62000c
                      p3: 'sequence'=0x3c0e11
            time in wait: 17.317927 sec
           timeout after: never
                 wait id: 580
                blocking: 0 sessions
            wait history:
              * time between current wait and wait #1: 0.000594 sec
              1.       event: 'direct path write'
                 time waited: 0.000362 sec
                     wait id: 579             p1: 'file number'=0x10e
                                              p2: 'first dba'=0x8956b
                                              p3: 'block cnt'=0x1
              * time between wait #1 and #2: 0.000102 sec
              2.       event: 'direct path read'
                 time waited: 0.000200 sec
                     wait id: 578             p1: 'file number'=0x10e
                                              p2: 'first dba'=0x8956b
                                              p3: 'block cnt'=0x1
              * time between wait #2 and #3: 0.000065 sec
              3.       event: 'db file sequential read'
                 time waited: 0.000287 sec
                     wait id: 577             p1: 'file#'=0x10e
                                              p2: 'block#'=0x8956b
                                              p3: 'blocks'=0x1
    }
    and is blocked by
 => Oracle session identified by:
    {
                instance: 2 (xxxx.xxxx2)
                   os id: 156652
              process id: 1364, oracle@xxxx2
              session id: 491
        session serial #: 21279
    }
    which is waiting for 'gc freelist' with wait info:
    {
            time in wait: 0.105962 sec
      heur. time in wait: 4.308367 sec
           timeout after: 0.094038 sec
                 wait id: 345
                blocking: 281 sessions
            wait history:
              * time between current wait and wait #1: 0.000207 sec
              1.       event: 'gc freelist'
                 time waited: 0.199268 sec
                     wait id: 344
              * time between wait #1 and #2: 0.000734 sec
              2.       event: 'gc freelist'
                 time waited: 0.199474 sec
                     wait id: 343
              * time between wait #2 and #3: 0.000604 sec
              3.       event: 'gc freelist'
                 time waited: 0.199331 sec
                     wait id: 342
    }

Chain 1 Signature: 'gc freelist'<='enq: TX - index contention'
Chain 1 Signature Hash: 0x7a6e5ce1
从现象上来跟Oracle mos文档
描述是极为类似的。同时分析了其他diag trace完全类似,均在等待gc freelist。
根据文档提供的解决方案如下:
Workaround
A possible short term solution is to set  _gc_element_percent = higher value say 140 or 160 (default is 120).
This would require instance restart.
后面建议同事先把该参数从默认值110调整成200 观察几天试试。从目前调整的结果来看,2天过去了,一切正常。
发表回复